Standard Graphs of Sine and Cosine
The graphs of sine and cosine functions are basically shaped like waves that move up and down in a repeating pattern. This behavior is similar to a simple harmonic motion. When something is in simple harmonic motion, it is moving in a periodic wavelike motion. Oscillate is a term that is commonly used when explaining the graphs of sine and cosine functions since oscillation means moving back and forth in a regular speed.
In order to start sketching the graphs of sine and cosine, you need to know what the parent, or standard, graphs of each one looks like. To draw the graphs of the standard sine and cosine functions, you need to know and have a good background on reference angles. It is possible to just use a graphing calculator to look at the points, but it will be very difficult to draw the more complicated graphs where the amplitude, period, and/or translations changed. Assuming you know what the reference angles for sine and cosine, create a table for both of the two using x as 0, π/2, π, 3π/2, and 2π.
In order to start sketching the graphs of sine and cosine, you need to know what the parent, or standard, graphs of each one looks like. To draw the graphs of the standard sine and cosine functions, you need to know and have a good background on reference angles. It is possible to just use a graphing calculator to look at the points, but it will be very difficult to draw the more complicated graphs where the amplitude, period, and/or translations changed. Assuming you know what the reference angles for sine and cosine, create a table for both of the two using x as 0, π/2, π, 3π/2, and 2π.

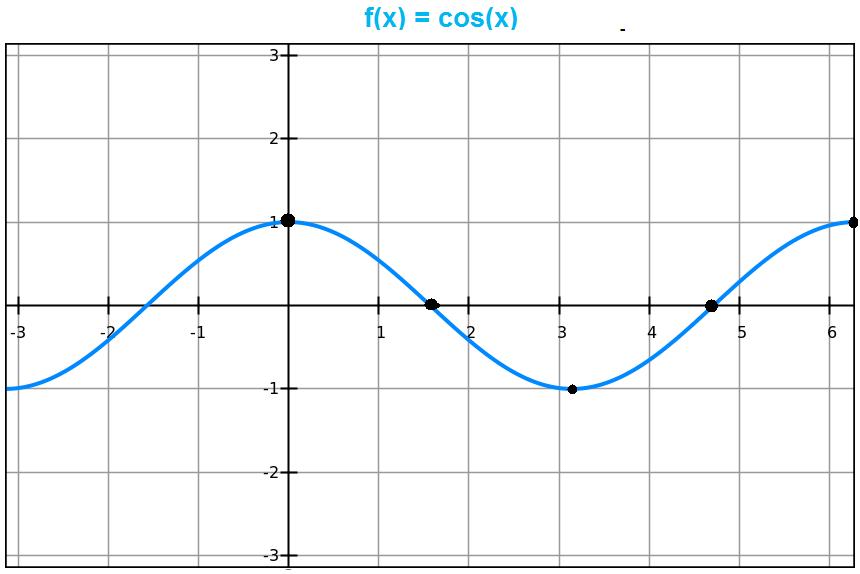
Using each data, plot the points of the sine and cosine functions onto graph paper.

|
|
Notice any similarity between the two functions? The sine and cosine graphs are the exact same shape, but the only difference is that they are transitions of each other. When the sine function is shifted π/2 units left, it becomes a cosine function, while when the cosine function is shifted π/2 units right, it becomes a sine function. These shifts are horizontal translations which will be further discussed later on. Another pattern that is present is that the wave repeats itself every 2π units. This is the period, since the wavelike pattern is repeats every 2π units. Now that you know the standard graphs of sine and cosine, you can now learn the changes of sine and cosine graphs which are the amplitude, period, and translations.
5 Key Points
It will help to understand and identify the 5 key points in a single period of both the sine and cosine graphs since it would make sketching and plotting the points much faster. In one period of each graph, there are x-intercepts, maximum point(s), and minimum point(s). Recall that x-intercepts are when a point is on the x-axis. For a sine function, f(x) = sin x, there are 3 x-intercepts, 1 maximum point, and 1 minimum point. For a cosine function, f(x) = cos x, there are 2 x-intercepts, 2 maximum points, and 1 minimum point. These 5 points should be the ones to plot when sketching a graph each time.

Amplitude
Amplitude is the degree in which the graph of either a sine or cosine function will stretch or shrink vertically. This is also called the scaling factor. In more simple terms, the amplitude is how high and how low the graph is going. Thus, the amplitude changes the maximum and the minimum points. The amplitude factor will be defined a.
f(x) = a sin x f(x) = a cos x
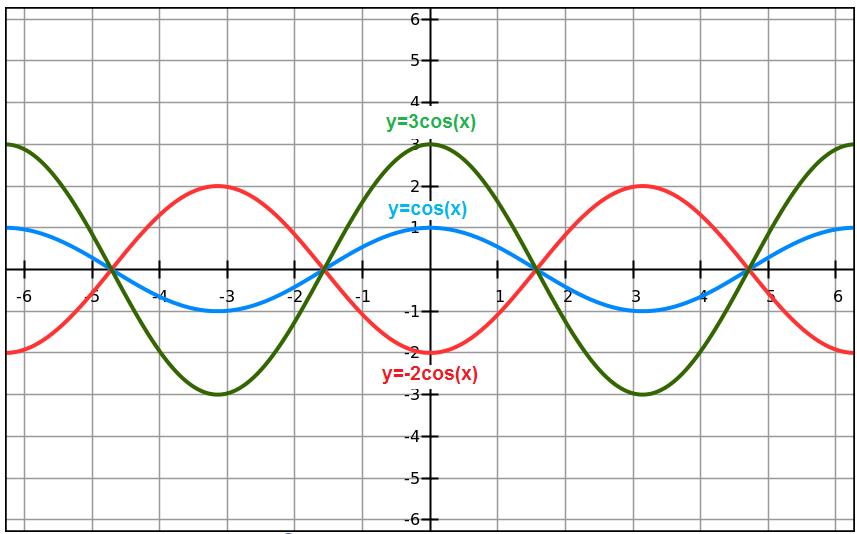
In the standard functions, both graphs have a maximum at 1 and minimum at -1. When there is the variable a in the function, the maximum point becomes a and the minimum point becomes -a. If a>1, then it is a vertical stretch. If a<1, then it is a vertical shrink. When amplitude a is a negative number, then the maximum point becomes the minimum point which means the minimum point will become the maximum point. This is known as a reflection.
f(x) = a sin x f(x) = a cos x
In the standard functions, both graphs have a maximum at 1 and minimum at -1. When there is the variable a in the function, the maximum point becomes a and the minimum point becomes -a. If a>1, then it is a vertical stretch. If a<1, then it is a vertical shrink. When amplitude a is a negative number, then the maximum point becomes the minimum point which means the minimum point will become the maximum point. This is known as a reflection.

|
|
Period
The period is how long one unique wave is before it begins to repeat that same pattern. The period of both the standard functions of sine and cosine are 2π. The period factor will be defined as b. To determine what the period of a function will be, use the following equation: Period = 2π/b
f(x) = sin b(x) f(x) = cos b(x)
If b>1, then it is a horizontal shrink. The period will become smaller. I remember it by thinking larger numbers speed up the wave so it is faster to perform one oscillation. If b<1, then it is a horizontal stretch. The period will become larger. I remember it by thinking small numbers slow down the speed of the wave so it takes longer.

|

|
Translations
A translation is a shift. There are 2 types of translations that can occur in a sine or cosine graph. The first one is a horizontal translation. A horizontal translation is a shift that moves left or right. The horizontal translation factor will be defined as c. The factor c is located inside the sine or cosine.
f(x) = sin (x - c) f(x) = cos (x - c)
To determine the extent of a horizontal shift, focus your attention inside the parenthesis, set it equal to 0, and isolate the x. The value that you found for x will be the distance of the horizontal translation. For example, if x= +2π, then shift the graph by +2π units to the right.

The second type of translation is a vertical translation. A vertical translation is a shift that moves up or down. The vertical translation factor will be defined as d. The factor d is located outside the sine or cosine.
f(x) = d + sin x. f(x) = d + cos x
Think of this transition as the "center line indicator" because whatever number d is will be how far up or down the shift is. In a standard sine or cosine function, the center line is at 0 since d=0. The graph will oscillate in a repeated wavelike pattern around y=d. If d>0, then the shift is up. If d<0, then the shift is down. The purple line in the figure below shows the "center line" for each of the function.

Complete General Sine and Cosine Function
You now know and understand all the factors that can change the standard form of a sine or cosine graph.
The equation of each is shown below:
f(x) = d + a sin b(x - c) f(x) = d + a cos b(x - c)
The equation of each is shown below:
f(x) = d + a sin b(x - c) f(x) = d + a cos b(x - c)
